With LNG demand rising in Asia and falling in Europe, there have been some noticeable shifts in the destination of LNG sales.
The U.S. remained the largest LNG exporter, with a total of 35.41 million tonnes (mt) sold internationally from January to May.
This was down 0.2% year on year from 35.48 mt shipped over the same period in 2023. Australia followed with 33.79 mt in 2024, up 1.3% year on year from 33.37 mt. Qatar came third with 32.65 mt in January-May 2024, down 0.3% drop from 32.74 mt in 2023.
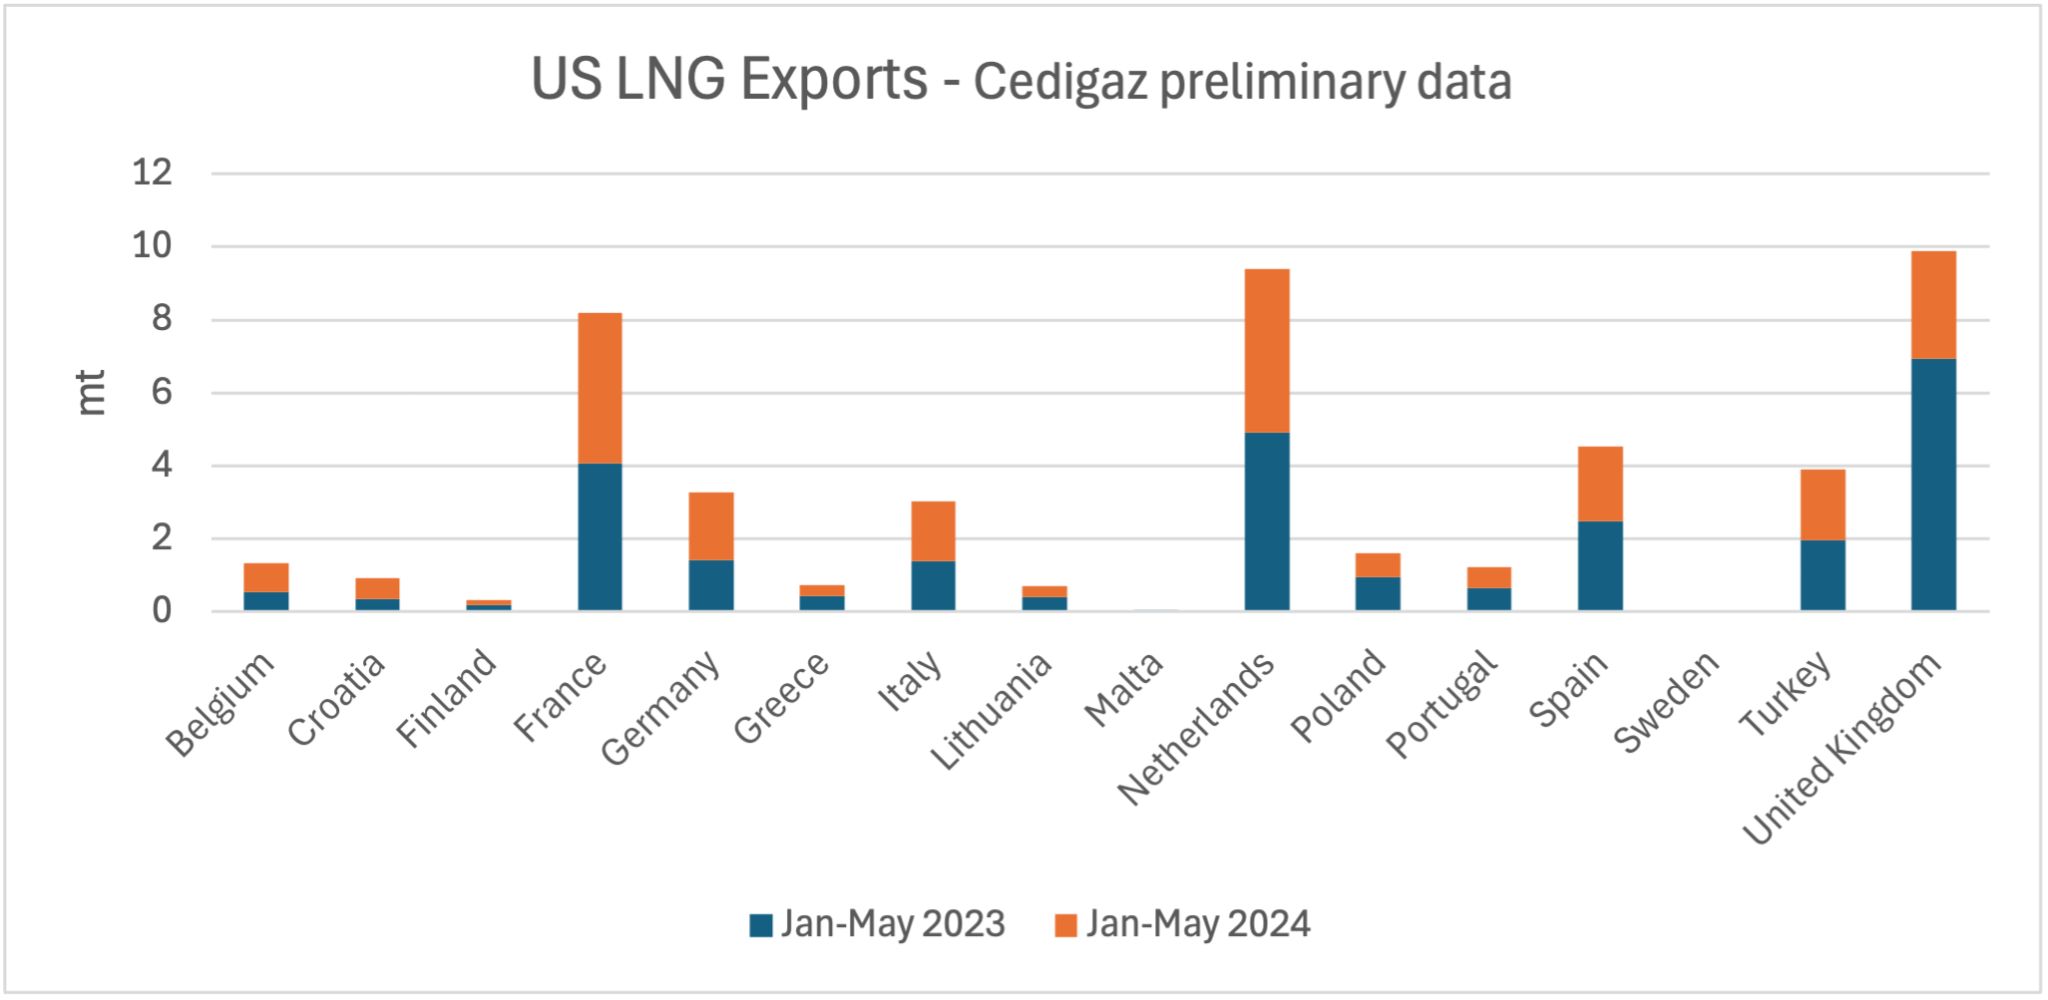
U.S. LNG exports to Asia rose by around 41% year on year to 9.7 mt over the first five months of 2024
In contrast, US LNG sales to Europe fell by 16.4% year on year to 22.4 mt. US LNG imports to Europe saw the most significant drop in terms of absolute decrease, with flows dropping by 4.38 mt.
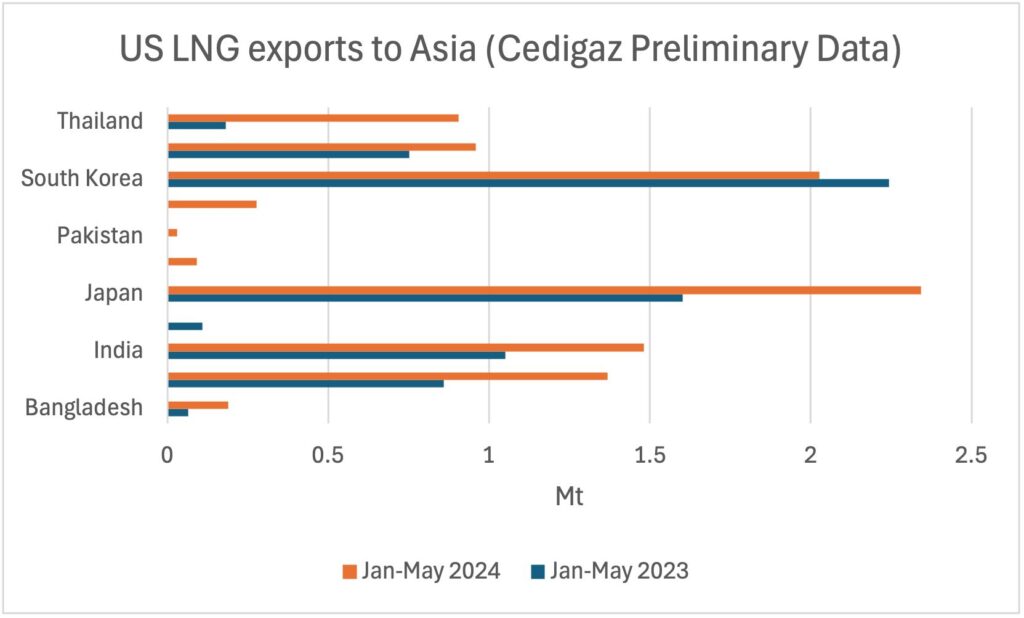 Notably, U.S. LNG sellers targeted China (+59% to 1.4 mt) and price sensitive importers such as Bangladesh (up 190% annually to 0.19 mt), India (up 41% annually to 1.4 mt), and Thailand (up 396% year on year to 0.91 mt). US shipments to Japan also increased by 46.3% year on year to 2.34 mt.
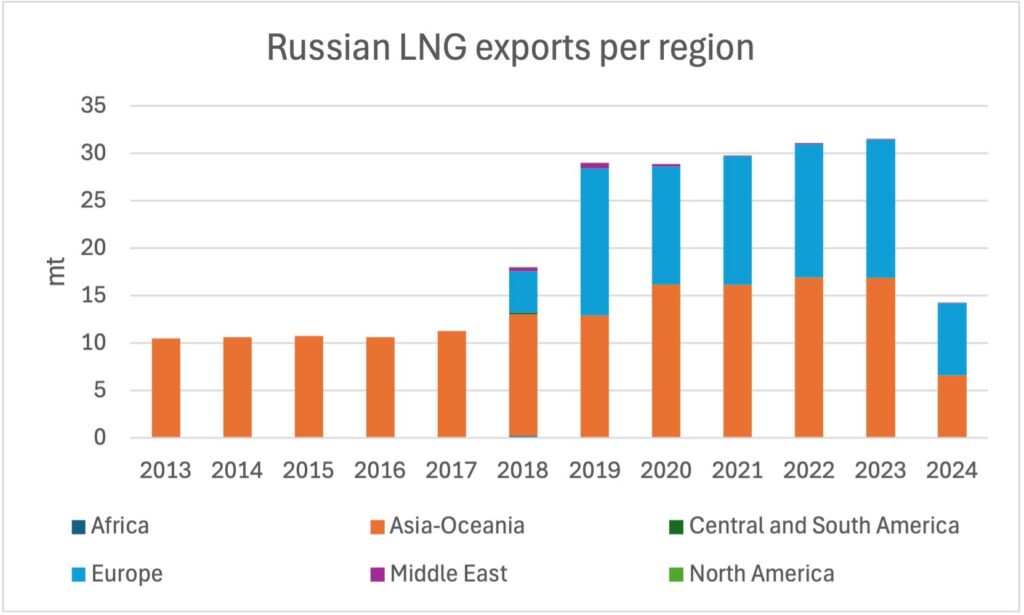
Russia was the fourth largest LNG exporter, with 14.29 mt in 2024, up 6.6% from 13.41 mt.
It posted the largest absolute increase (+0.88 mt). Higher LNG exports from the Sakhalin 2, Vysotsk, and Yamal LNG facilities contributed to the rise in March and April. In January, increased LNG exports were partly attributed to higher output from the Portovaya and Yamal LNG facilities.
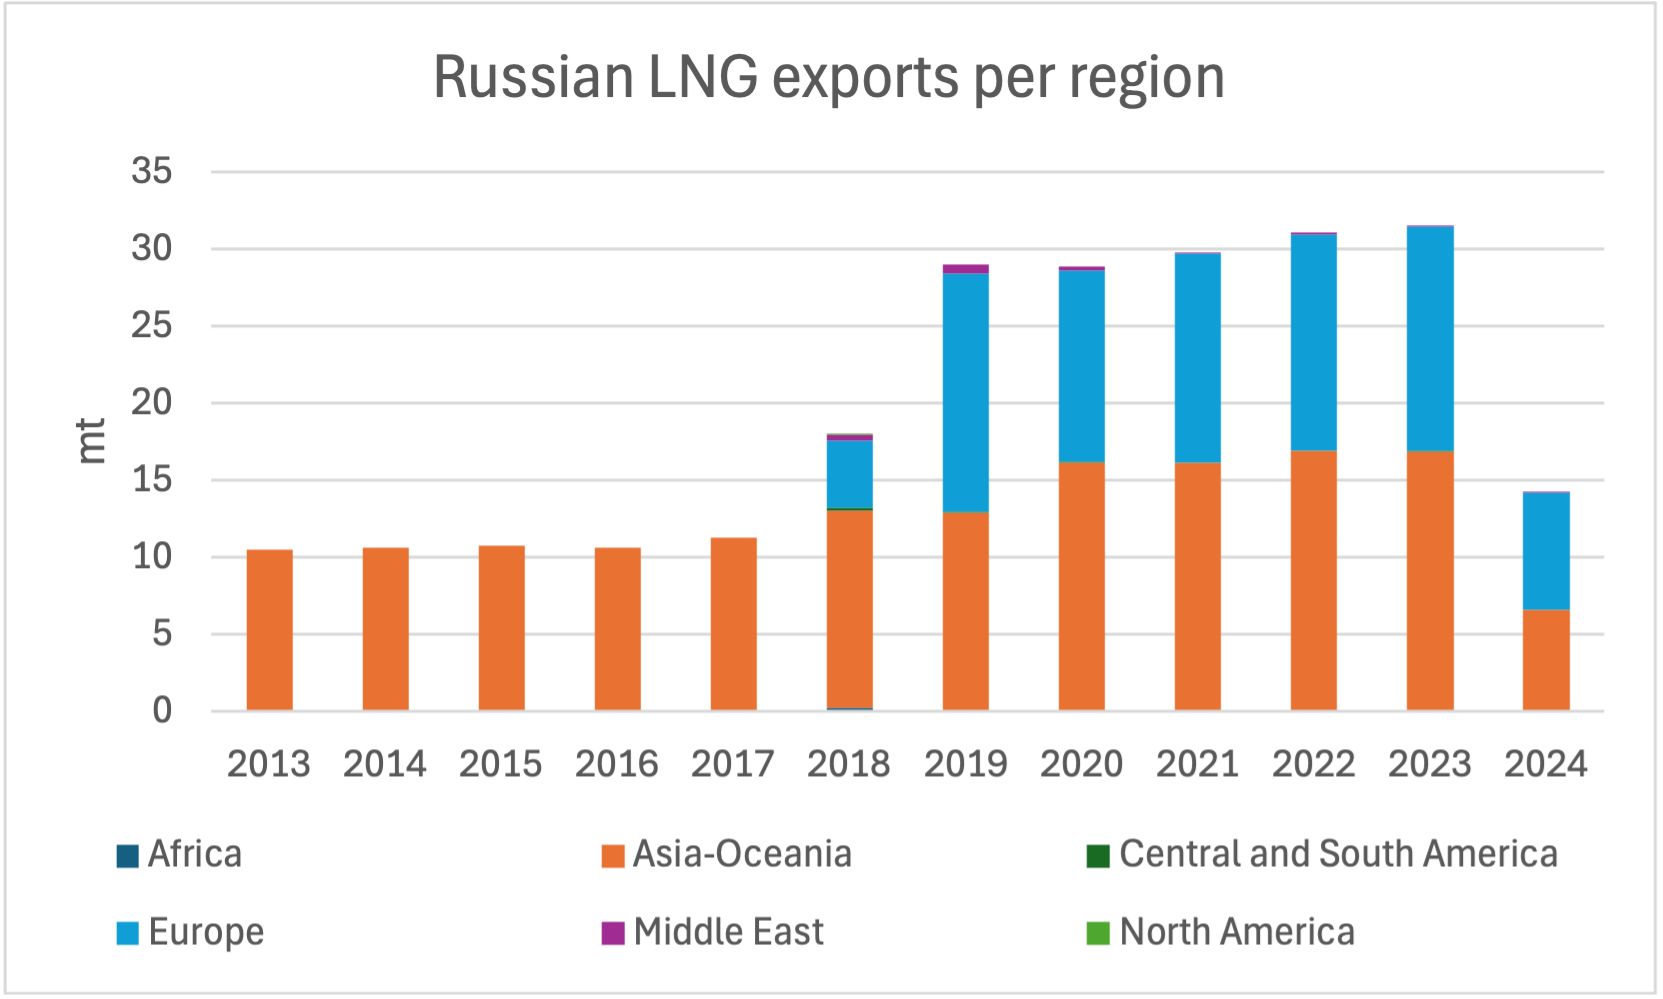
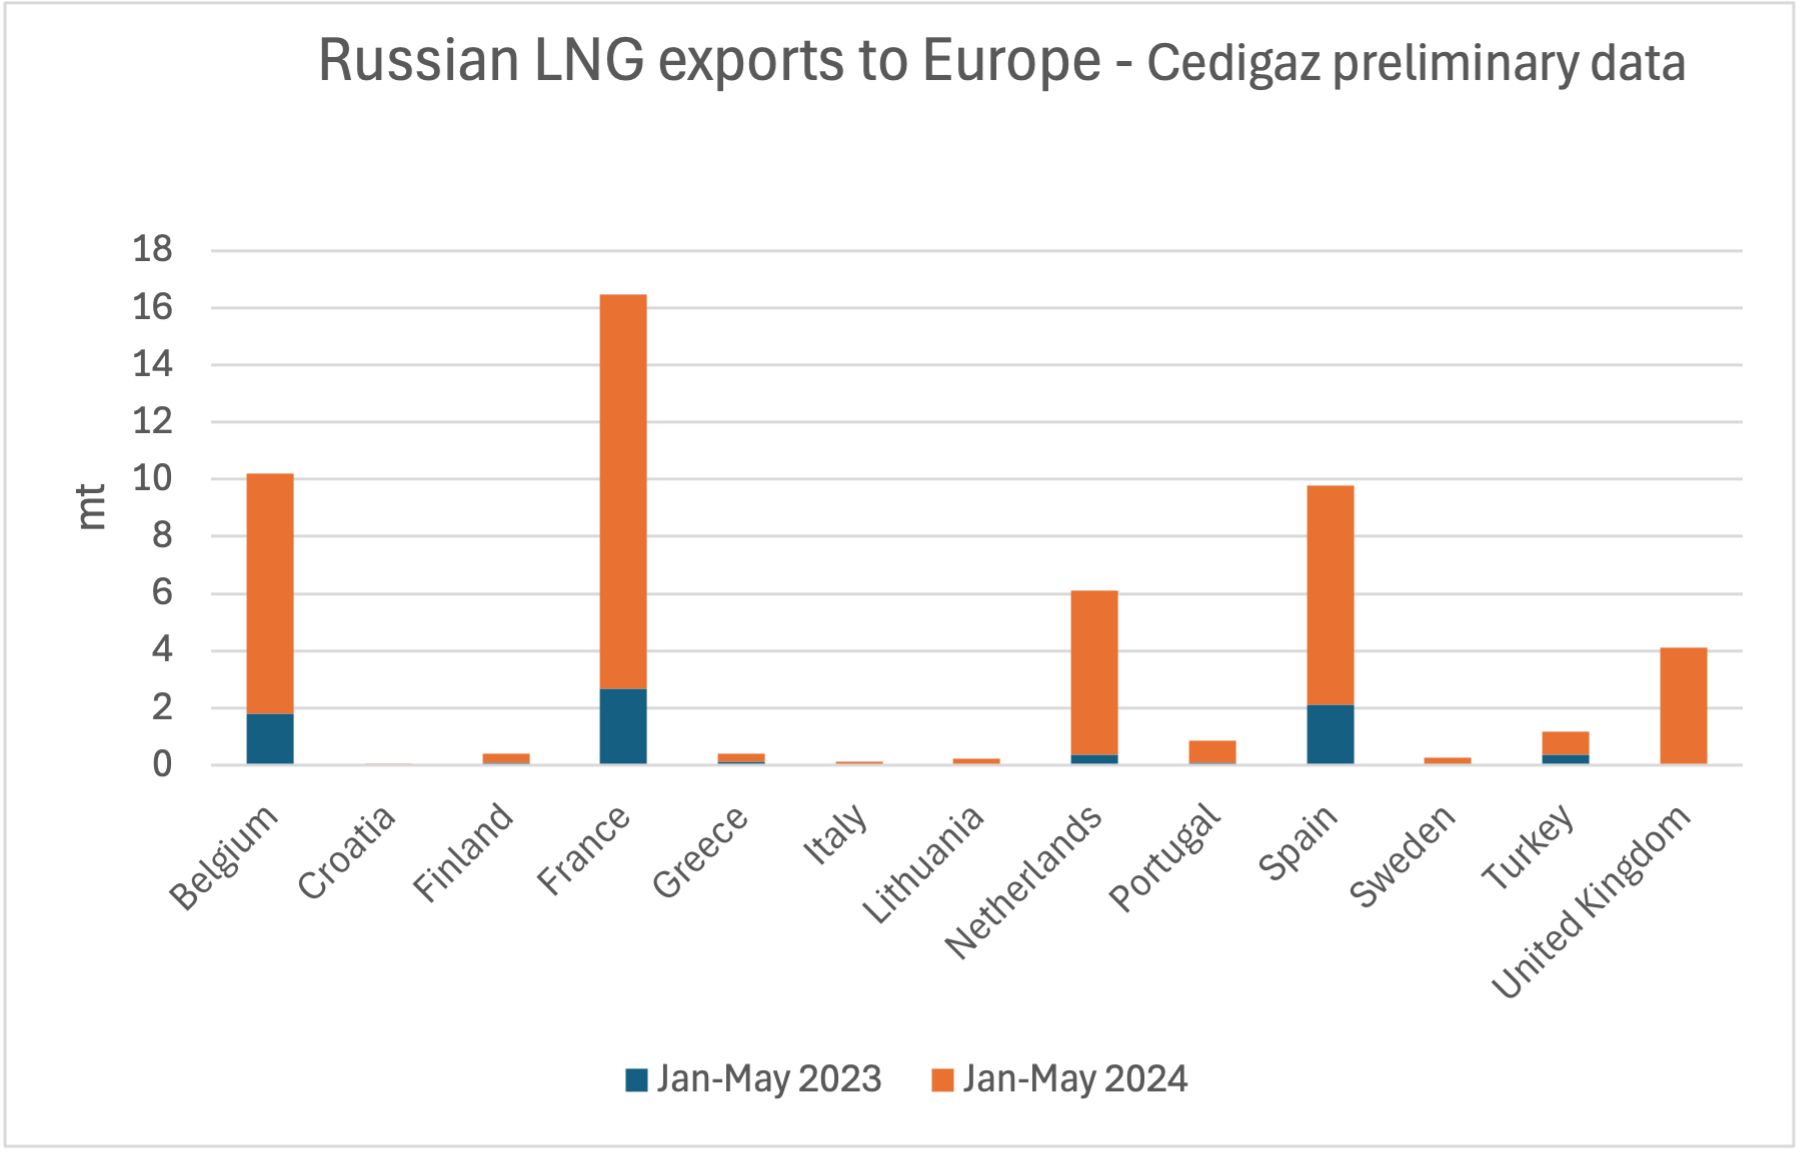
Europe was the first destination of Russian LNG, with exports rising by 13.2% year on year to 7.6 mt over January-May.
Higher imports into France were behind this increase (+1.42 mt, or 114% higher year on year to 2.7 mt).
Egypt’s LNG exports experienced the sharpest decline in global exports in terms of absolute changes, dropping by 2.05 mt to 0.72 mt from 2.77 mt over January-May 2023.
Egypt has returned to being a net gas importer, reversing its position as an exporter.
Source: Cedigaz

