Hormuz LNG supply losses largely offset by rising output elsewhere

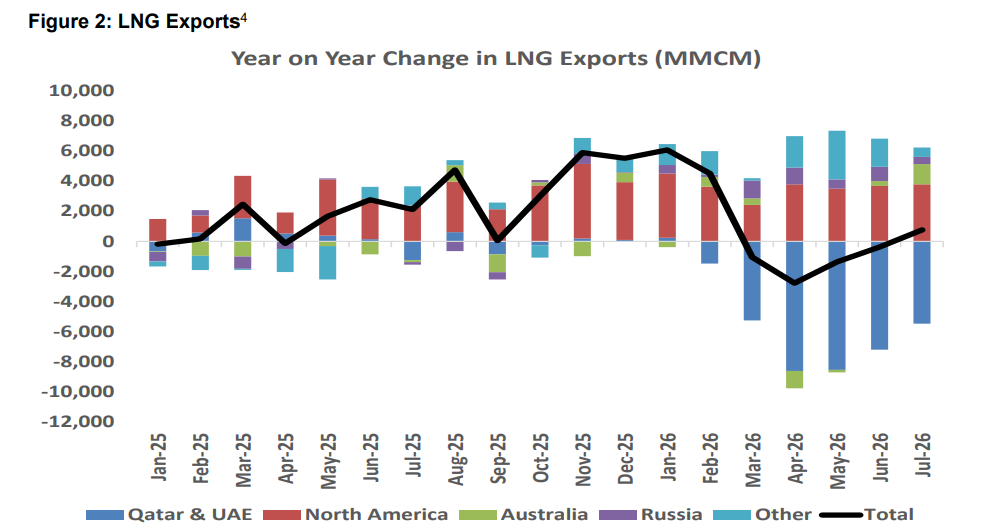
Figure 2 shows year‑on‑year change in LNG exports (MMCM) from Jan 2025 to Jul 2026. Horizontal axis lists months, vertical axis shows change values up to ±12,000. Bars are stacked by region (Qatar & UAE in blue, North America in red, Australia in green, Russia in purple, Other in light blue) and a black line represents the total LNG exports trend over time.

Hormuz LNG supply disruptions have removed around 7.1 bcm per month of Qatari and UAE volumes from international markets compared with 2025, but rising production elsewhere has offset almost all of the shortfall. New analysis finds that additional LNG supply from North America and other producers added around 6.8 bcm per month during May-July, leaving the global market with a net […]

This report is premium content Start a FREE 30-day trial to read this report and unlock our full library of 2,400+ LNG reports, white papers, and presentations.
Enjoy weekly updates and cancel anytime during the trial if it’s not for you.
FREE TRIAL
Already a subscriber ? Log in
RELATED POSTS