
China LNG imports declined again during the first seven months of 2026, extending the sharp contraction recorded last year and pushing China behind Japan in the global importer rankings. Behind the headline decline, however, the country’s supply mix is undergoing a significant reshuffle as geopolitical disruption and changing trade relationships redirect volumes towards Australia, Southeast Asia, Russia and Canada.
Global seaborne LNG trade rebounded sharply in Jan-Dec 2025, with shipment volumes rising +5.8% y-o-y to 431.9 mln t. In Jan-Jul 2026, global exports declined -1.6% y-o-y to 241.8 mln t, from 245.9 mln t in Jan-Jul 2025.
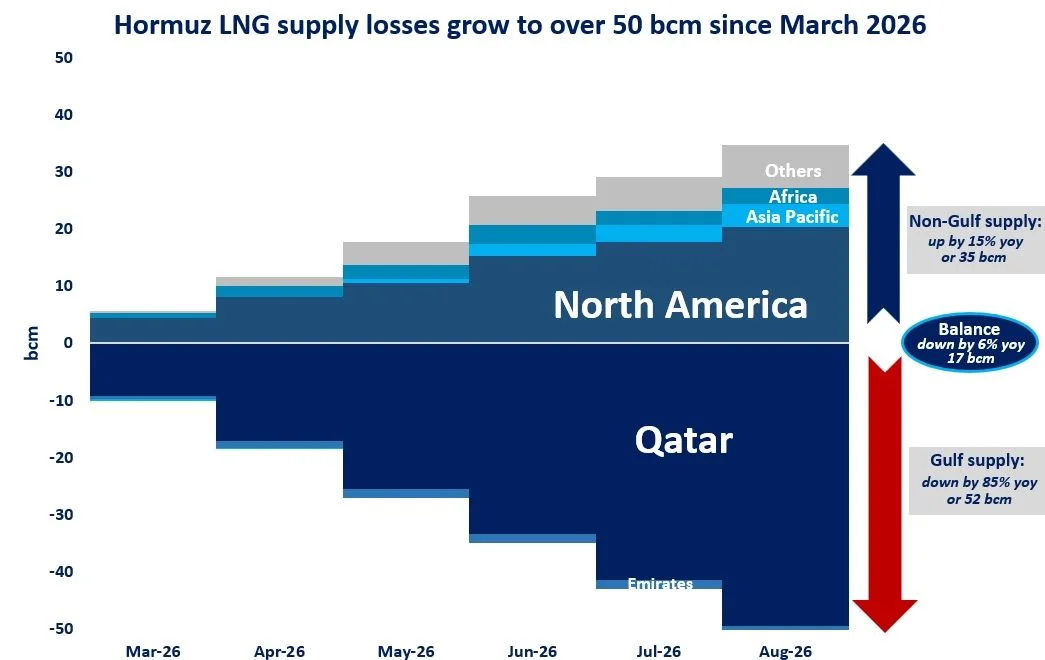
The largest exporter of LNG is now the USA, which accounted for 30.6% of shipments in Jan-Jul 2026, followed by Australia with 19.5%, South-East Asia with 9.7%, and Russia with 7.8%. Qatar, hit by the closure of the Strait of Hormuz, saw its share drop to just 7.1%.
In Jan-Jul 2026, the USA exported 74.1 mln tonnes of LNG, which represented a +21.6% y-o-y increase from 60.9 mln t shipped in Jan-Jul 2025.
Qatar exported just 17.2 mln tonnes in Jan-Jul 2026, down -64.3% y-o-y from 48.2 mln t a year earlier, as the closure of the Strait of Hormuz halted the bulk of Qatari shipments from March 2026 onwards.
Australia shipped 47.2 mln tonnes in Jan-Jul 2026, up +2.0% y-o-y. From South East Asia shipments increased +4.1% y-o-y to 23.5 mln t.
Russia shipped 18.9 mln tonnes of LNG in Jan-Jul 2026, up +10.4% y-o-y from 17.1 mln t in Jan-Jul 2025.
The European Union remains the world’s largest importer of LNG, accounting for 24.2% of global LNG imports. In Jan-Jul 2026, the EU imported 58.7 mln t, down -4.6% y-o-y from the record 61.5 mln t in Jan-Jul 2025, and marginally below the 59.8 mln t in Jan-Jul 2023. The United Kingdom imported 6.2 mln tonnes of LNG in Jan-Jul 2026, up +5.3% y-o-y from the 5.9 mln t in Jan-Jul 2025, but still well below the 10.9 mln imported in Jan-Jul 2023.
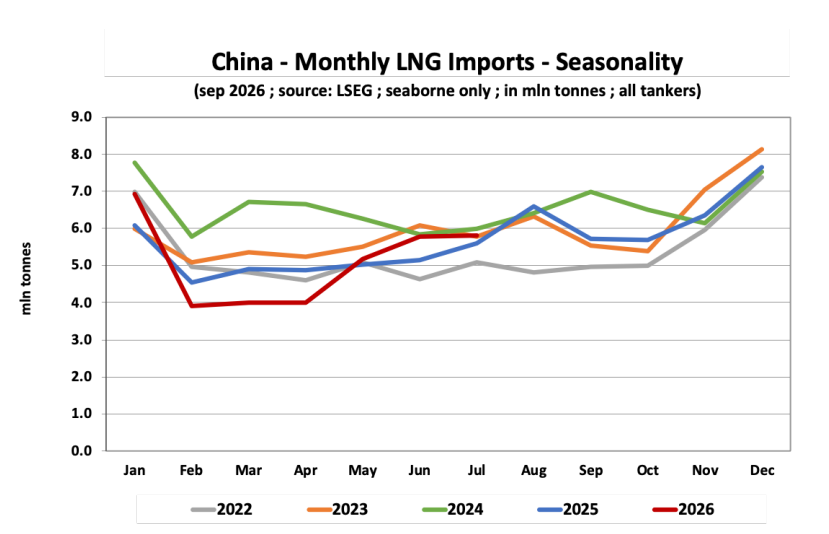
China imported 35.3 mln tonnes of LNG in Jan-Jul 2026, down -2.5% y-o-y from 36.2 mln t in Jan-Jul 2025. Japan imported 37.3 mln t in Jan-Jul 2026, down -2.6% y-o-y. South Korea imported 26.9 mln t in Jan-Jul 2026, down -4.0% y-o-y. India imported 14.0 mln t in 2026, up +0.9% y-o-y.
In 2021, Mainland China emerged briefly as the largest importer of LNG in the world, with a 20.7% share. However, both China and Japan got leapfrogged in 2022 by the European Union, whose LNG imports surged by +67.6% y-o-y to 100.1 mln tonnes, from 59.7 mln t in 2021, as Western Europe rushed to replace pipeline gas supply from Russia.
In 2025 the two moved in opposite directions again: Chinese imports dropped -13.3% y-o-y to 68.2 mln t, whilst EU imports rebounded +25.8% y-o-y to a record 104.5 mln t. China nonetheless held on to second place, just ahead of Japan’s 67.3 mln t.
In Jan-Jul 2026, Chinese imports fell a further -2.5% y-o-y to 35.3 mln t, slipping back behind Japan on 37.3 mln t, with the EU well ahead on 58.7 mln t.
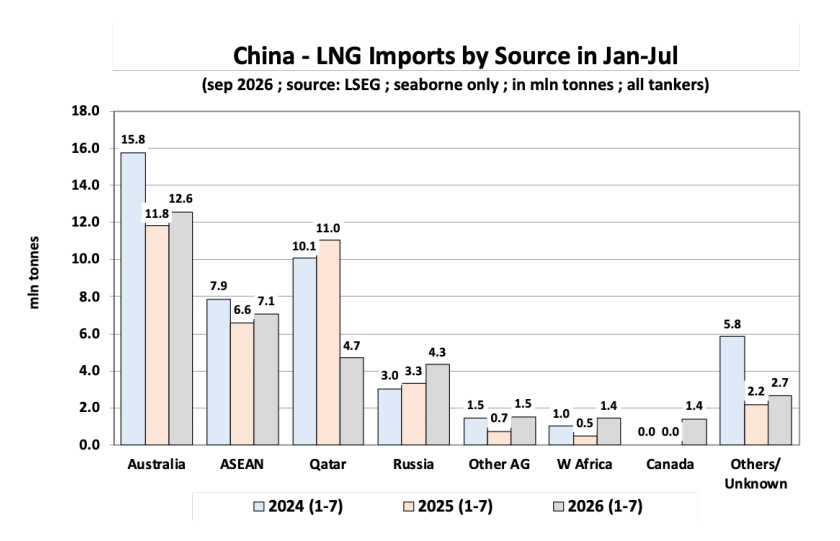
In terms of sources for LNG shipments into China, there has also been a big reshuffle, largely driven by geopolitical factors.
In Jan-Jul 2026, China imported 12.6 mln tonnes of LNG from Australia, up +6.3% y-o-y from 11.8 mln tonnes in Jan-Jul 2025.
Australia remains the top supplier to China, with a 35.6% share in Jan-Jul 2026.
Imports to China from ASEAN (Malaysia, Indonesia, Brunei and Singapore) increased +6.9% y-o-y to 7.1 mln t in Jan-Jul 2026, making ASEAN the second largest source with a 20.0% share.
Shipments from Qatar to China collapsed -57.6% y-o-y in Jan-Jul 2026 to just 4.7 mln t, from 11.0 mln t a year earlier, as the closure of the Strait of Hormuz halted the bulk of Qatari exports from March 2026. Qatar’s share of China’s LNG imports fell to 13.3%.
Volumes from Russia to China increased +31.3% y-o-y to 4.3 mln t in Jan-Jul 2026, from 3.3 mln t in Jan-Jul 2025, lifting Russia’s share to 12.3%.
Canada has emerged as a new supplier, shipping 1.4 mln t to China in Jan-Jul 2026, a 4.0% share, against no cargoes at all in Jan-Jul 2025.
Finally, shipments from the USA to China have all but disappeared, down -71.7% y-o-y to a mere 0.1 mln t in Jan-Jul 2026, just 0.2% of the total.
Source: Bancosta Weekly, Market Report – Week 35/2026