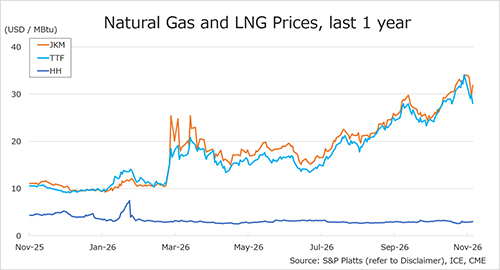
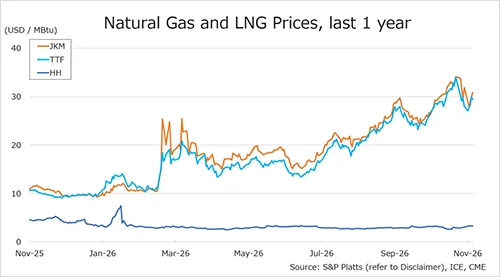
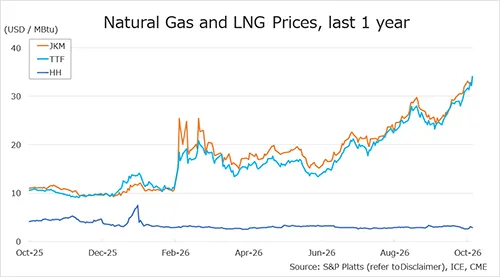
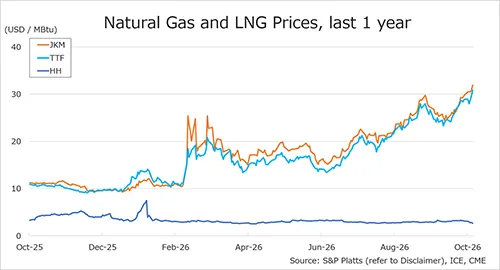
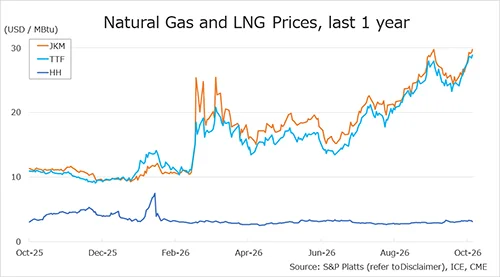
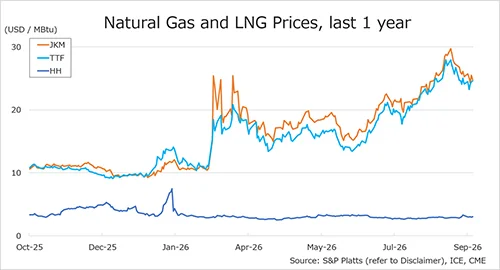
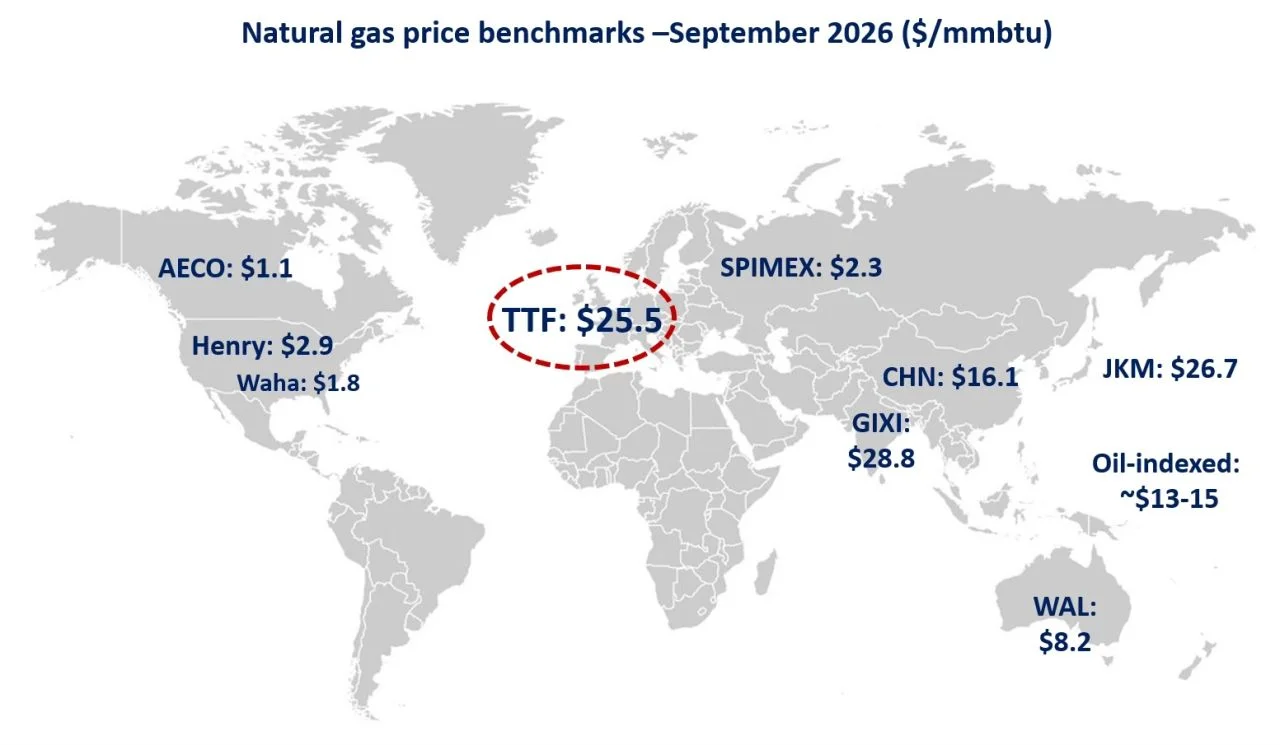
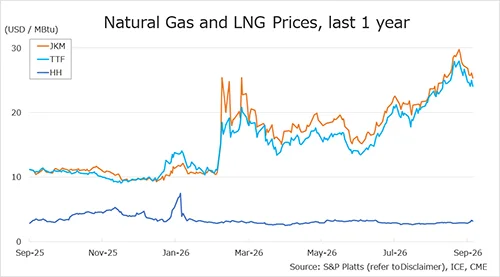
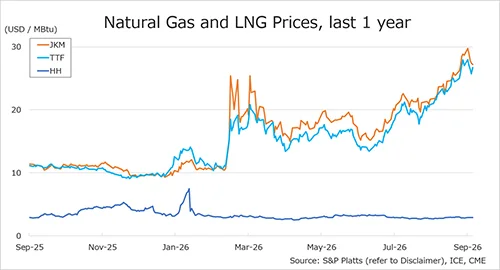
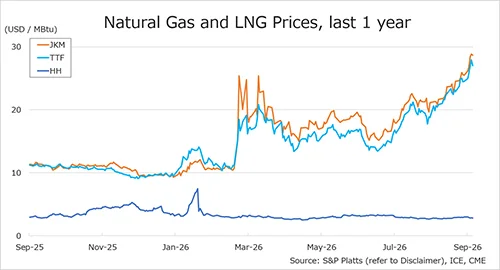
Natural gas prices showed mixed movements across major markets last week. Asian JKM prices declined as geopolitical risk premiums eased, while European TTF and U.S. Henry Hub prices rose on colder weather forecasts, stronger heating demand and continued LNG supply concerns.
Asia – JKM
The Northeast Asian assessed spot LNG price JKM (December delivery) for last week (9–13 November) fell to low-USD 30s/MBtu on 13 November from low-USD 31s/MBtu the previous weekend (6 November).
At the beginning of the week, JKM dropped sharply to the high-USD 27s/MBtu on 10 November, following the market holiday on 9 November, as concerns over escalating tensions between the US and Iran receded, reducing the geopolitical risk premium.
Thereafter, prices rebounded as lower prices stimulated buying interest in South and Southeast Asia, while the global LNG supply-demand balance continued to be viewed as tight, rising to the low-USD 29s/MBtu on 11 November.
Prices continued to rise from 12 November, supported by persistently low European underground gas storage levels and the narrow JKM-TTF spread, which made arbitrage flows to Asia difficult.
On 13 November, renewed geopolitical concerns in the Middle East pushed JKM up to the high-USD 30s/MBtu.
METI announced on 11 November that Japan’s LNG inventories for power generation as of 8 November stood at 1.92 million tonnes, unchanged from the previous week.
Europe – TTF
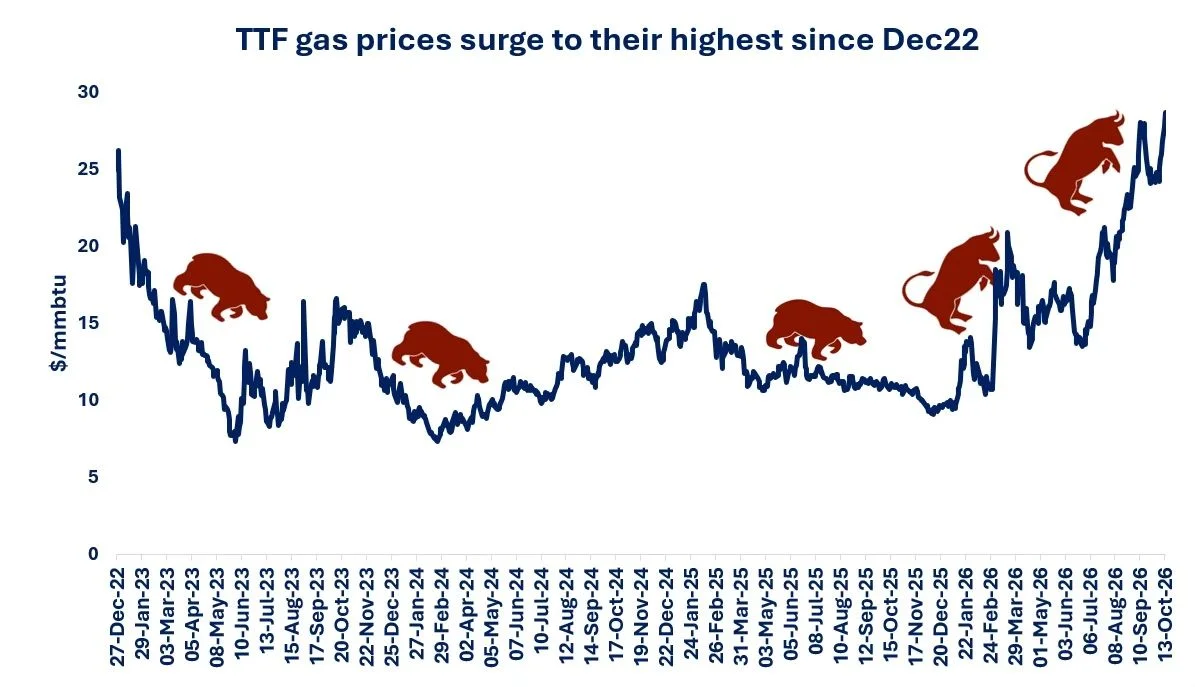
The European gas price TTF for last week (9–13 November, December delivery) rose to USD 29.5/MBtu on 13 November from USD 28.0/MBtu the previous weekend (6 November).
At the beginning of the week, TTF fell to USD 27.1/MBtu on 9 November, as expectations grew for progress in US-Iran peace talks, easing market concerns over the situation in the Middle East, while Norwegian pipeline gas supplies remained stable.
From 10 November, prices rebounded amid expectations of stronger heating demand due to colder weather in Northwest Europe, reduced Norwegian supplies and gas storage withdrawals.
On 11 November, unplanned maintenance at Norway’s Troll and Asgard gas fields and slower LNG inflows into Europe provided further upward pressure, lifting TTF to USD 28.3/MBtu.
On 12 November, prices rose to nearly USD 30.0/MBtu, as colder weather and the first Dunkelflaute of the winter, a period of cloudy conditions and weak winds resulting in lower renewable power generation, reduced wind and solar output and increased demand for gas-fired power generation. Escalating tensions in the Middle East also supported prices.
On 13 November, however, TTF edged back to USD 29.5/MBtu as Norwegian supplies remained stable.
According to AGSI+, EU-wide underground gas storage was 70.8% on 13 November, down from 73.0% the previous weekend, down 14.6% from the same period last year and down 20.3% from the five-year average.
United States – Henry Hub
The U.S. gas price HH for last week (9–13 November, December delivery) rose to USD 3.2/MBtu on 13 November from USD 3.0/MBtu the previous weekend (6 November).
Prices rose at the beginning of the week on forecasts of colder weather and expectations of stronger heating demand, and climbed further to USD 3.3/MBtu on 10 November amid forecasts of colder conditions in the eastern US.
On 11 November, prices edged lower as above-normal temperatures were forecast across the central and northern US, nationwide gas inventories remained above the five-year average, and the EIA lowered its gas price outlook.
On 12 November, HH rose to USD 3.4/MBtu, supported by forecasts of colder weather, record feedgas flows to major LNG export terminals of 19.3 Bcf/d, and lower gas production in the Lower 48 states.
However, forecasts for warmer-than-normal temperatures and profit-taking weighed on the market, sending HH back to USD 3.2/MBtu on 13 November to close the week.
The EIA Weekly Natural Gas Storage Report released on 13 November showed U.S. natural gas inventories as of 6 November at 3,862 Bcf, up 61 Bcf from the previous week, down 2.3% from the same period last year and 2.0% above the five-year average.
Source: JOGMEC
Updated: 16 November 2026