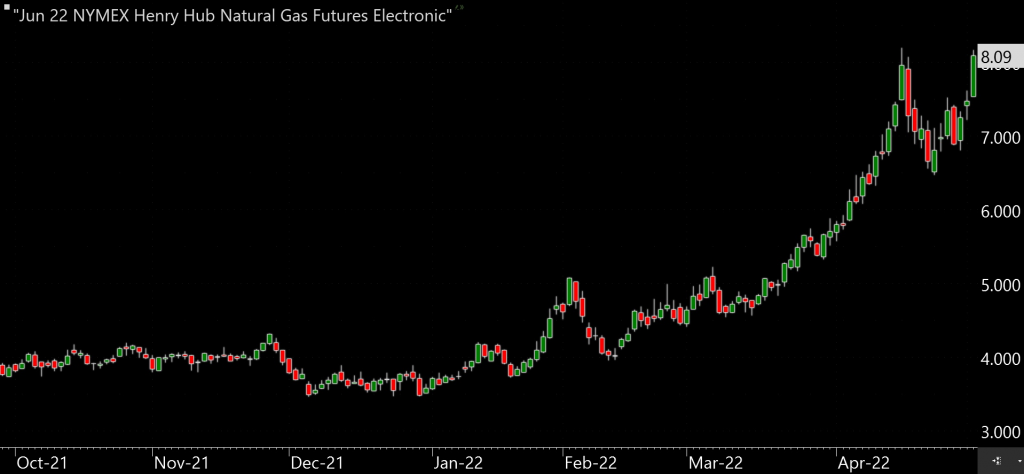
The June contract rose by 61 cents to rise to a high of $8.16/MMbtu, where it is currently testing prior resistance levels established in early April.
The continuous prompt month chart (not displayed) would imply that current prices are well beyond their April predecessors and fail to explain why price is struggling to surge beyond $8.16/MMbtu; continuous charts obfuscate hidden resistance levels that are quite clear to see in an individual view of the June contract (shown below).
In April, the June contract failed to surpass $8.17/MMBtu; this morning, the first test of this critical resistance level also failed.
Throughout the remainder of the day, we will likely retest the $8.16/MMbtu resistance level once again. Further upside risk exists in the market should we surpass this technical barrier.
source: Gelber and Associates

