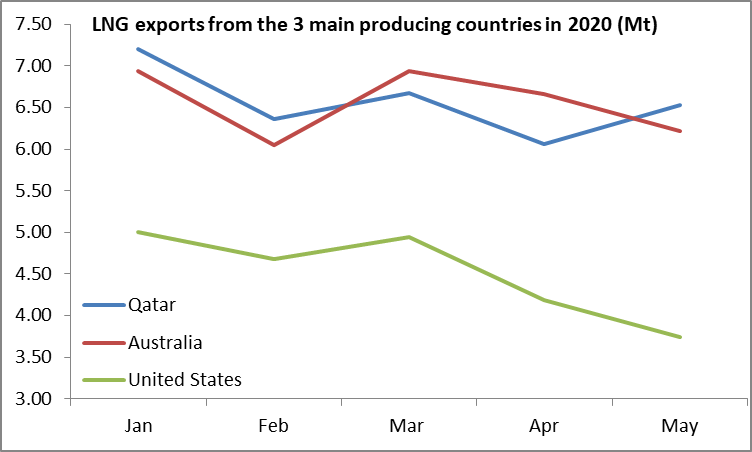
(Cedigaz) LNG trade in May showed a relatively slow and mild supply response to weak prices. Strongest cuts in the US while Qatari and Australian shippings remained high. Capacity utilisation in May in line with 5 year average.
Global LNG net imports were up 0.46 Mt in May 2020 compared to April and essentially stable year-on-year (-0.2%) after a 2% Y-o-Y decline in April. These figures contrast with the 11.5% Y-o-Y growth recorded in Q1. Global net imports in May were 13% below January’s which demonstrates a certain level of supply response to low prices but is also largely a seasonal phenomenon. Indeed, in the five year period between 2015 and 2019, the decline in monthly imports from January to April has varied from -20% in 2015 to -6% in 2017.
LNG exports in May 2020 represented approximately 82% of the global liquefaction installed capacity which was only marginally lower than the average capacity utilization at this time of the year over the 5 previous year.
They increased by 1% compared to May 2019, with the largest increases in the United States, Nigeria, Algeria and the Russian Federation, reflecting higher capacity utilization in the latter three countries and the launch of a number of new liquefaction trains in 2019 and early 2020 in the United States, where nominal liquefaction capacity increased from 34 to 65 Mtpa between May 2019 and May 2020.
A relatively mild supply side response
Overall these volumetric figures alone do not give an accurate picture of the dismal state of the LNG market, better reflected in the spot prices which remained at record low levels in every region. They point out to a relatively slow supply side response due to the limited flexibility allowed by long-term contracts that still represent the majority of LNG global sales. For the sake of comparison, pipeline gas imports to Europe (Turkey excluded) declined by 19% (-19 Mt) year on year in the first five months of this year and by 33% (-2Mt) to China, while global LNG imports were up by 6.4% or 9 Mt.
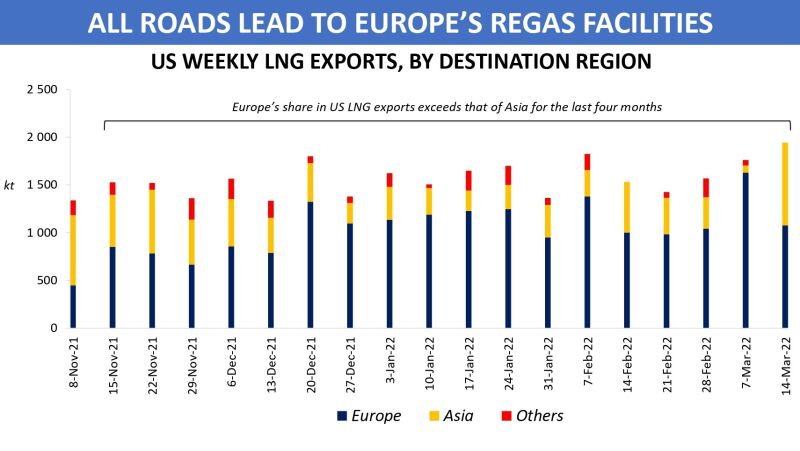
Nevertheless, US exports started to decline sharply in April as off takers started to cancel cargoes in reaction to weak prices. In May, they were 25% (-1.3 Mt) below the January figure, a much steeper decline than for Qatar (-0.7 Mt/-9%) and Australia (-0.7 Mt/-10%). Preliminary figures for June show a strong acceleration of the decline of US production.
Europe was the only growth region year on year
On the demand side, the market was supported by Europe, where imports grew by close to 1 Mt over May 2019. Imports declined in all other regions including Asia-Oceania where the strong imports growth reported in China was more than offset by declines in all other Asian countries but Taiwan.
Source: Cedigaz
See original article (with additional graphics) HERE
Connect with & follow Cedigaz on Twitter:
[tfws username=”Cedigaz_SG” height=”700″ width=”350″ theme=”light” color=”#FAB81E” tweets=”2″ header=”yes” footer=”yes” borders=”yes” scrollbar=”yes” background=”yes”]

