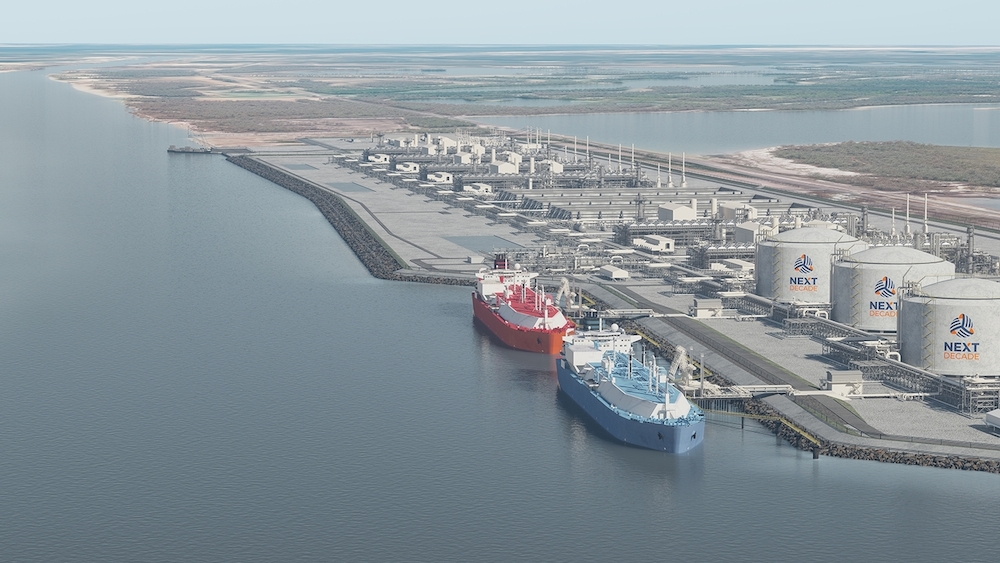

In the red corner is a large new wave of LNG supply, backed predominantly by North American & Qatari gas.
In the blue corner is Asian LNG demand growth, backed by two giants (India & China) as well as a range of high growth developing economies (e.g. Vietnam, Thailand & Pakistan).
In this article, Timera Energy previews the approaching battle, as well as checking in on the market set up in 2024.
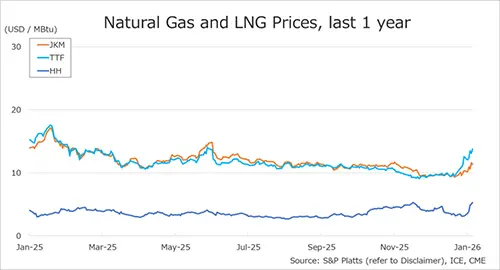
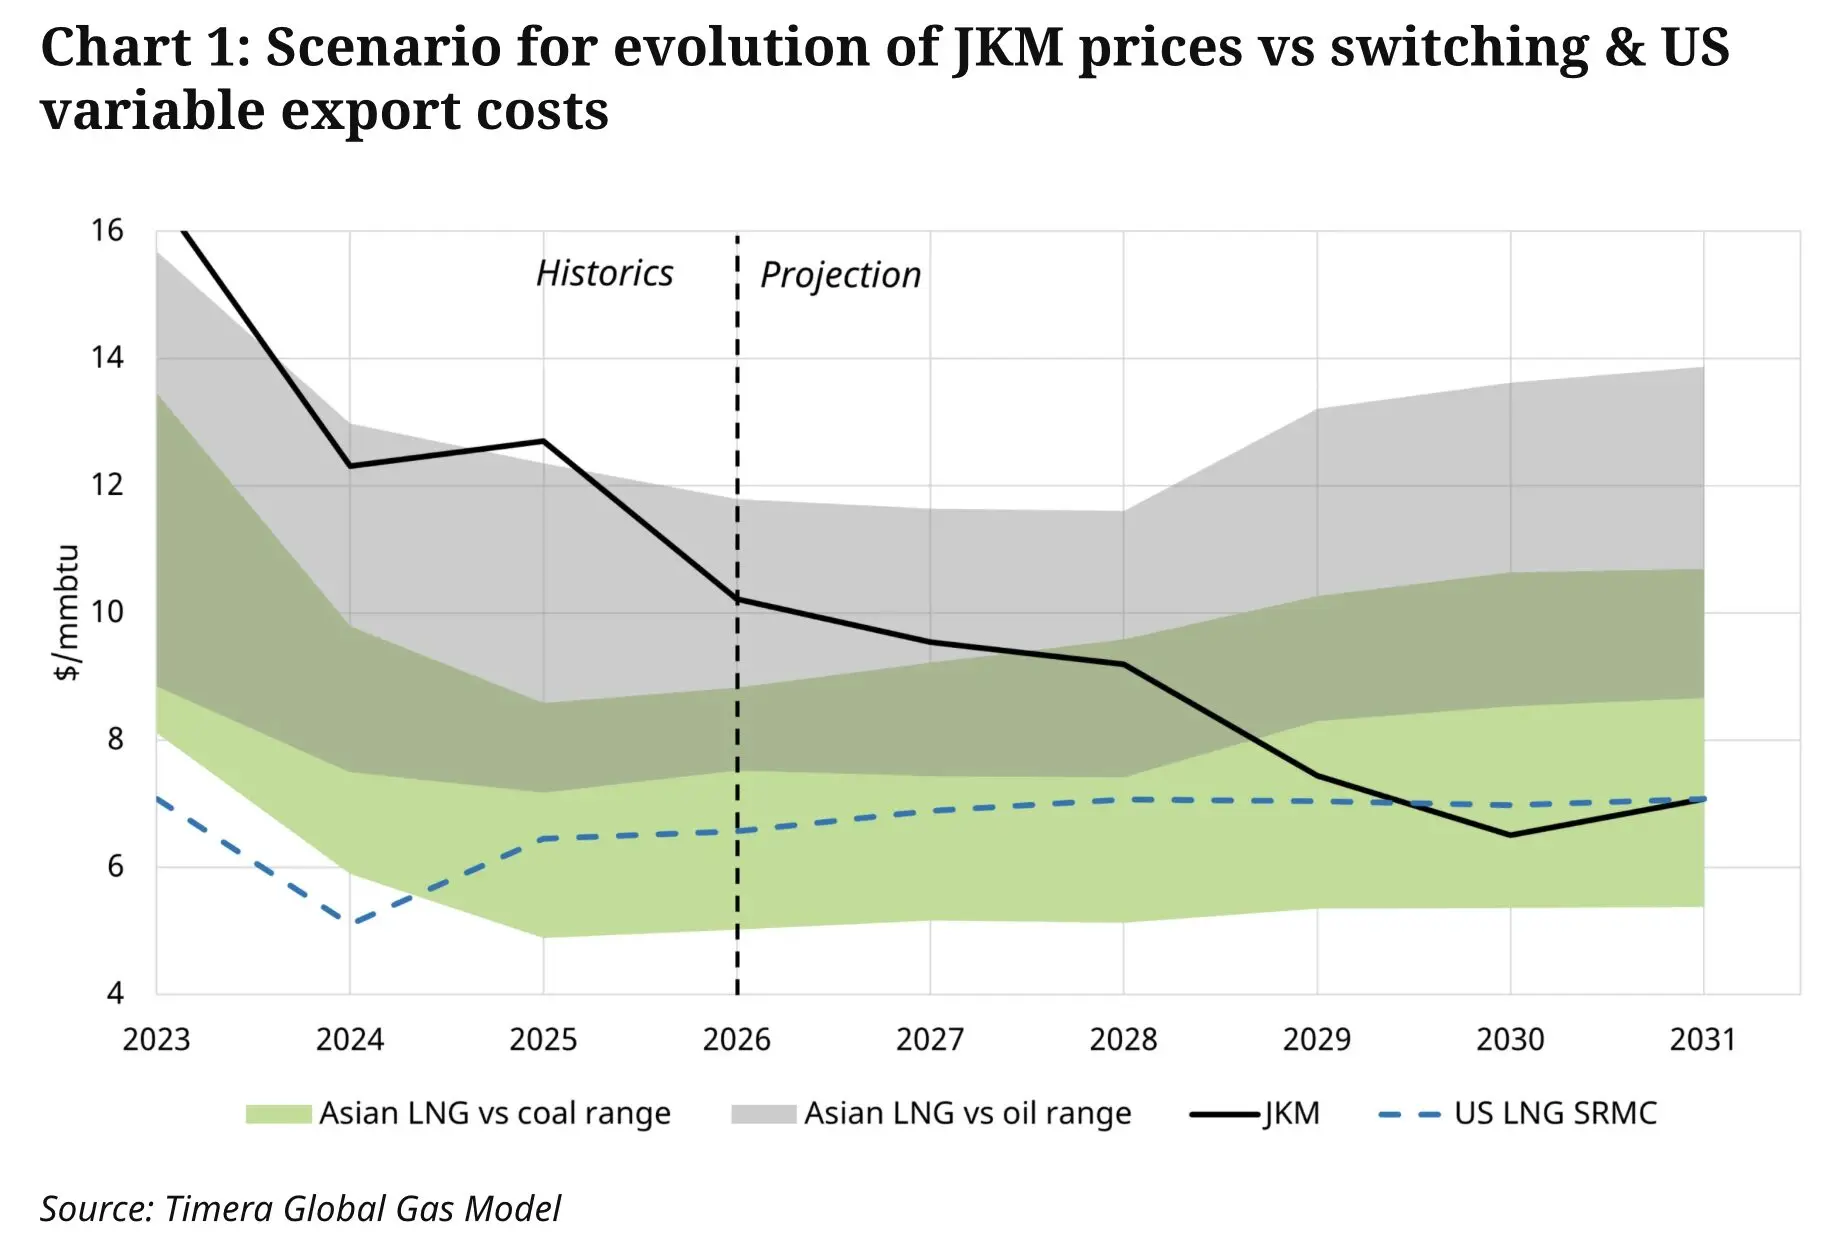
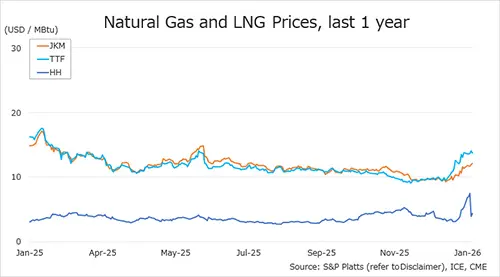
The European gas market remains the anchor for Atlantic & Pacific basin LNG prices. Asian prices (e.g. JKM) trade at a premium to European hubs (e.g. TTF), to incentivise adequate levels of marginal cargo flows to Asia in order to clear the LNG market.
The Nov 2023 to Feb 2024 period saw a sharp decline in European hub prices, with forward prices falling 40-50%. We recently published an article setting out factors behind the TTF winter price decline, including high storage inventories (~55% full as of late Mar), soft demand & falling coal & carbon prices (lowering coal for gas switching levels).
Since late Feb 2024 TTF prices have started a tentative recovery. This is being supported by early signs of a broader recovery in commodity prices, the most relevant of which are the switching drivers: coal, carbon EUAs and Brent.
Chart 1 shows recent analysis from 2024 global gas market supply & demand curves and marginal pricing dynamics.
 Source: Timera Energy global gas market model
The inelastic nature of supply & demand in the short term can drive price volatility in both directions. Current European gas & LNG market consensus is firmly bearish. If a broader commodity rally were to take hold, then European gas prices can rise just as quickly as they have fallen.
Pricing in 2024 & 2025 remains uncertain and subject to volatility, until the next wave of new LNG supply starts to ramp up in earnest into 2026. Let’s shift our focus there.
Our global gas model is projecting a 52% increase in global LNG supply by 2030. Substantial growth across the second half of this decade (2026-30) is being driven by post energy crisis FID of new liquefaction projects.
Last month, QatarEnergy announced FID on a new LNG expansion project, North Field West. The latest expansion represents a 16 mtpa increase on top of the existing 49 mtpa expansion of the North Field.
Chart 2 shows our Central case supply projections to 2031, including the incremental impact of this latest Qatari expansion (orange bars).
 Source: Timera Energy global gas model
There are some modest volumes of new supply capacity scheduled for 2024 start-up, including Arctic LNG 2, Tortue FLNG, Altamira Fast LNG, Congo FLNG, Corpus Christi Stage 3, and Plaquemines LNG.
Additional supply volumes are likely to decline materially into the 2030s as the market absorbs new gas. But in the meantime, the fate of the LNG market strongly depends on the performance of Asian LNG demand.
Chart 3 shows our Central case projection for Asian LNG demand (dark blue line). The grey shaded range represents our modelled range of price-induced demand flexibility across the Asian region. Our global gas modelling has a strong emphasis on analysing the drivers of Asian demand response as a key driver of marginal pricing in the LNG market.

Source: Timera Energy global gas model
Asian demand can be split into two distinct categories with quite different underlying trends:
Japan, Korea, Taiwan
The large traditional Japan, Korean & Taiwan (JKT) markets are set to experience relative stable demand this decade, before a structural decline take shape into the 2030s, driven by a shift towards nuclear & renewable electricity generation & broader decarbonisation in the case of Japan & Korea.
Developing economies
The future of Asian LNG demand growth depends much more on emerging economies.
Greg Molnar at the IEA flagged an interesting stat last week that puts potential Asian LNG demand growth in context: the entire increase in global LNG supply by 2030 accounts for less than 10% of Asia’s current coal consumption. In other words, power sector fuel switching alone can drive very strong demand growth. Industrial demand growth and electrification are also key drivers.
China is the most important demand source given the scale of its energy requirements, followed by India (reinforced by growth from Pakistan & Bangladesh). There are also other important sources of demand growth across Southeast Asia, including Singapore, Thailand, Vietnam, and the Philippines.
A boxing match has only three outcomes (win, lose, draw). That is where the analogy with the LNG market breaks down. It is important to start any analysis of market balance & pricing across 2026-30 with a respect for uncertainty.
The supply side of the market is a lot clearer than the demand side, given visibility from 4-5 year lead times on new liquefaction projects.
The demand side, particularly Asian demand growth, is more complex & encompasses a range of uncertainties (e.g. economic growth, policy impact on fuel choices, infrastructure build out).
One of the most important dynamics that we focus on in our LNG market modelling is the strong linkage between Asian LNG demand and market prices (as shown in Chart 3). Our modelling shows that there is a high probability that the LNG market transitions into an ‘oversupplied regime’ in 2026-27.
It may be the lower prices from oversupply that actually underpin the strong Asian LNG demand growth and a more rapid than expected rebalancing of the LNG market into the 2030s.
These issues will be discussed on on WEBINAR on APRIL 18.
Source: Timera Energy

