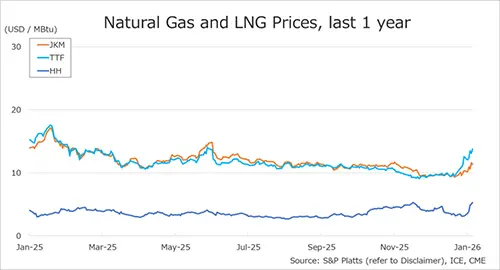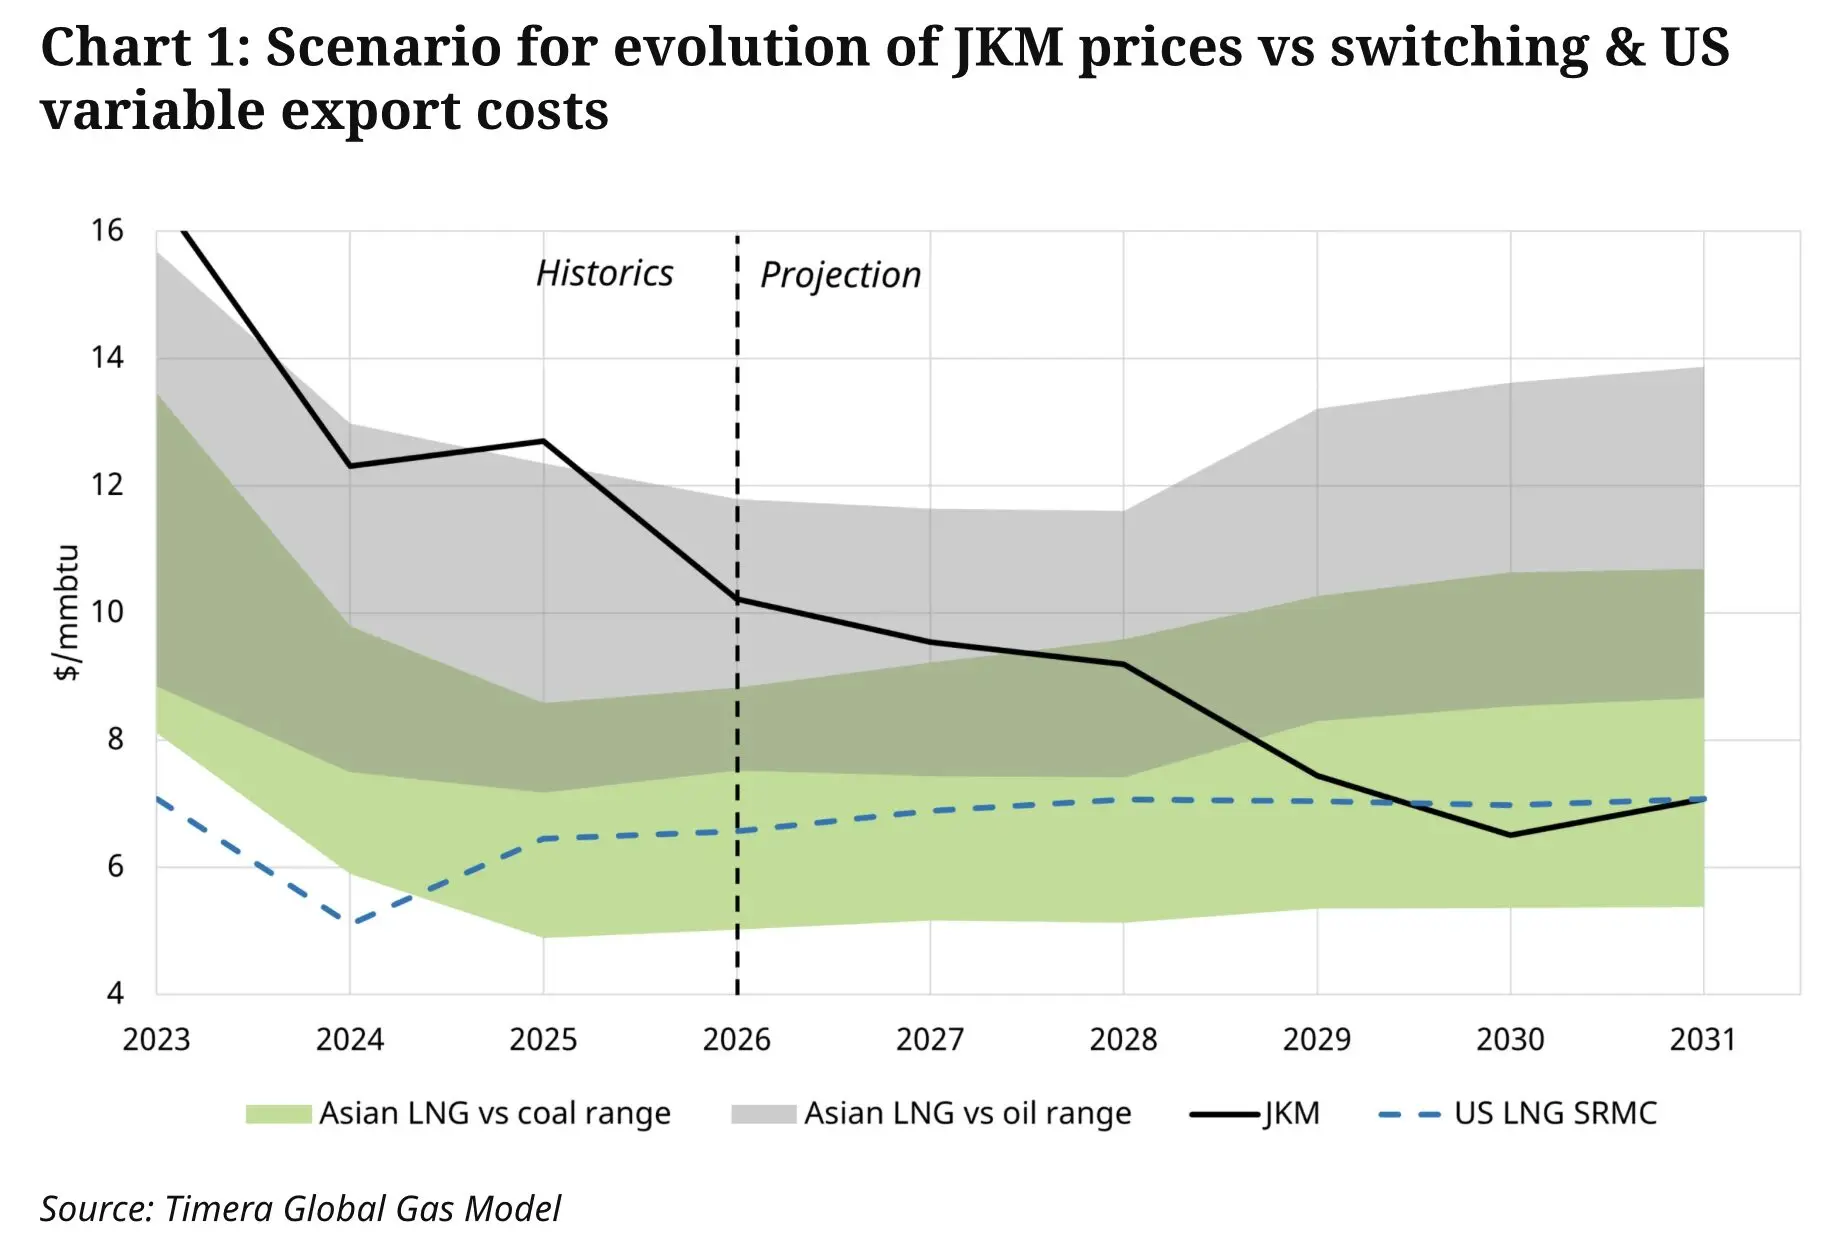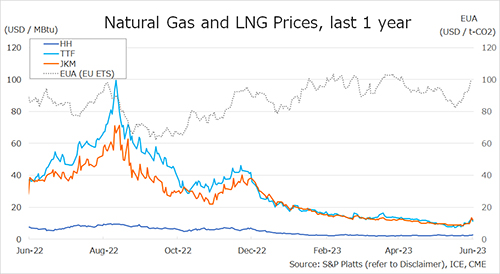
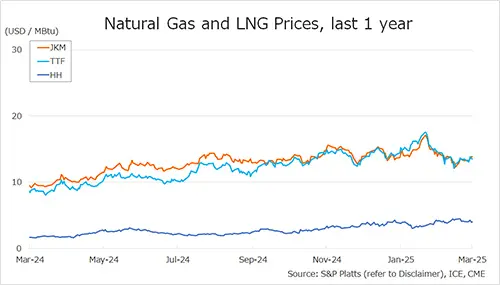
The Northeast Asian assessed spot LNG price JKM (May delivery) for last week (17 – 21 March) rose to high-USD 13s on 21 March from low-USD 13s the previous weekend (14 March, April delivery). JKM moved slightly in low-USD 13s range in the first half of the week while waiting for the outcome of the talks between the U.S. and Russia on the war in Ukraine.
In the second half of the week, it rose to high-USD 13s due to the rise in geopolitical risk caused by Russia’s attack on Ukrainian infrastructure. METI announced on 19 March that Japan’s LNG inventories for power generation as of 16 March stood at 1.56 million tonnes, down 0.22 million tonnes from the previous week.
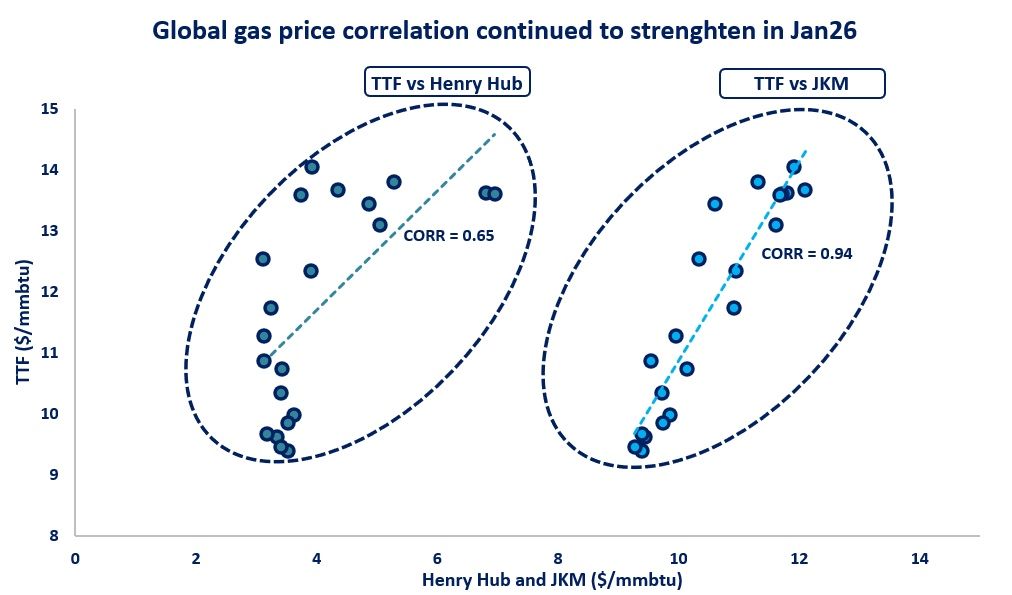
The European gas price TTF (April delivery) for last week (17 – 21 March) was almost unchanged at USD 13.5/MBtu on 21 March from USD 13.5/MBtu the previous weekend (14 March). TTF fell to high-USD 12s on 18 March due to forecasts of rising temperatures across Europe.
But then it rose to high-USD 13s on 19 March due to heightened geopolitical risks, including Russia’s attack on Ukrainian infrastructure. After that, it fell to mid-USD 13s due to stable supplies from Norway and weaker demand forecasts. According to AGSI+, the EU-wide underground gas storage was 33.8% on 21 March, down from 35.2% at the end of the previous weekend, down 42.6% from the same period last year, and down 24.4% over the five-year average.
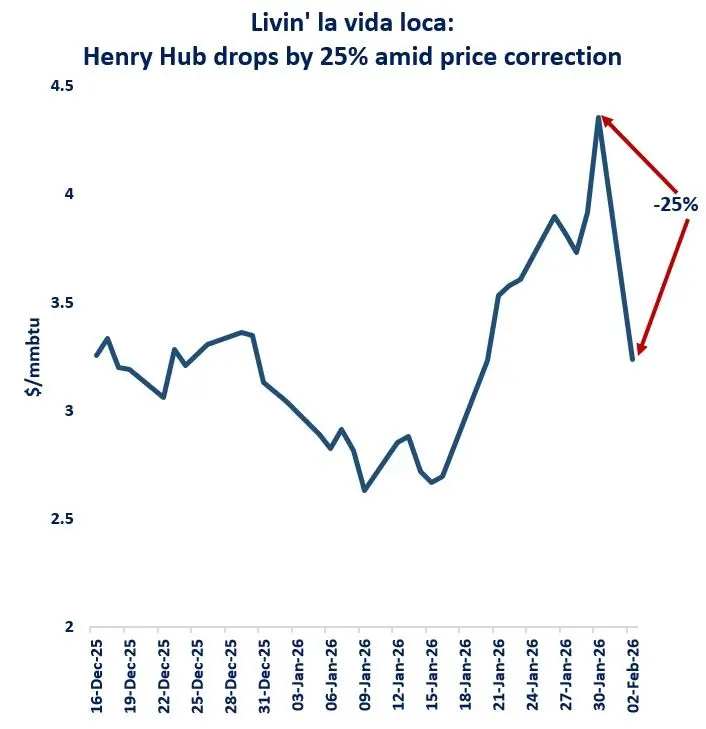
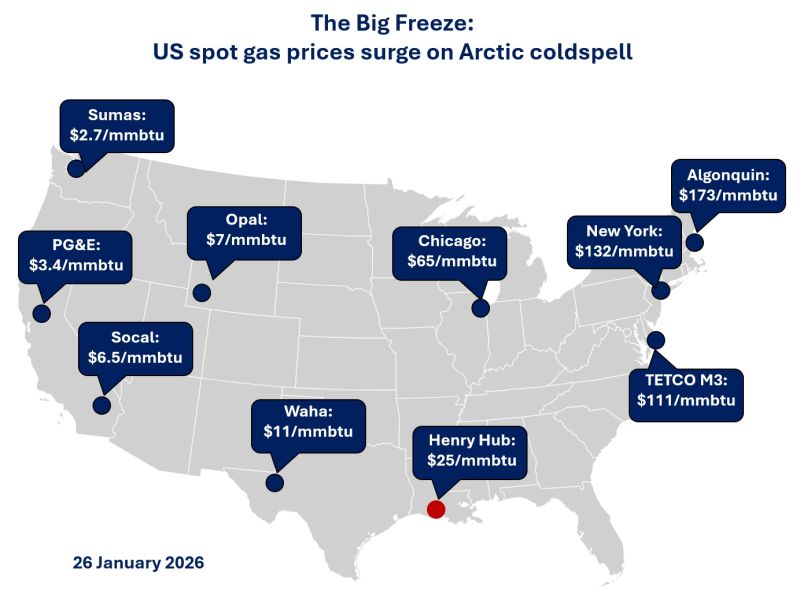
The U.S. gas price HH (April delivery) for last week (17 – 21 March) fell to USD 4.0/MBtu on 21 March from USD 4.1/MBtu the previous weekend (14 March). HH rose to USD 4.2/MBtu on 19 March due to forecasts of falling temperatures, reduced natural gas production due to pipeline maintenance, and increase of feed gas supply to LNG facilities.
Since then, it hovered around USD 4.0/MBtu as maintenance work has progressed. The EIA Weekly Natural Gas Storage Report released on 20 March showed U.S. natural gas inventories as of 14 March at 1,707 Bcf, up 9 Bcf from the previous week, down 26.8% from the same period last year, and 10.0% decrease over the five-year average.
Updated: March 24
Source: JOGMEC

