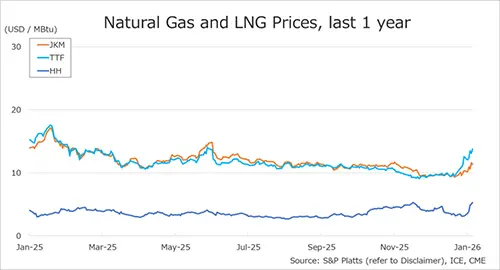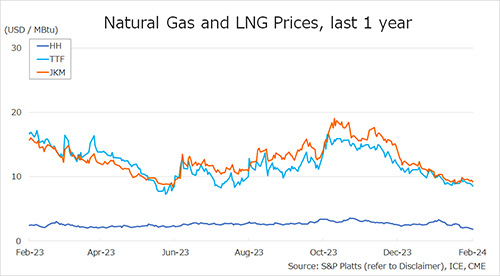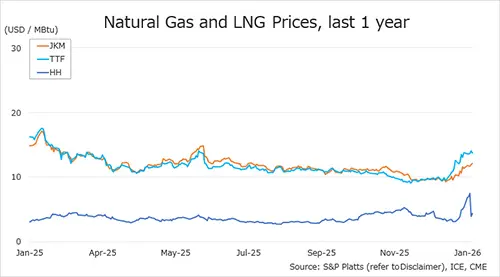

The Northeast Asian assessed spot LNG price JKM for the previous week (9 January – 13 January) rose slightly on 9 January from USD 23/MBtu the previous week, but then fell for three consecutive business days to USD 21/MBtu on 12 January due to thin trading and steady inventory levels.
On 13 January, JKM rose to USD 22/MBtu on concerns over the delay in Freeport LNG’s restart schedule and a slight improvement in spot demand due to recent weakening of LNG prices.
According to METI, Japan’s LNG inventories for power generation totaled 2.48 million tonnes as of 8 January, down 0.07 million tonnes from the previous week, but up 0.68 million tonnes from the end of the same month last year and up 0.79 million tonnes from the average of the past five years, indicating a steady inventory.
The European gas price TTF rose slightly to USD 23.3/MBtu on 9 January from USD 21.4/MBtu the previous week. TTF then fell for two consecutive business days to USD 20.6/MBtu on 11 January amid high European underground gas storage levels, strong UK wind output, and robust LNG supplies.
On 12 January, the price rose to USD 21.1/MBtu due to the prospect of lower temperatures in the short term and the announcement of an extension of the scheduled maintenance of Norwegian oil and gas fields and facilities, but fell back to USD 20.5/MBtu on the following day. According to AGSI+, EU-average underground gas storage was 81.70% as of 13 January, down slightly from 83.16% the previous week.
The U.S. gas price HH rose to USD 3.9/MBtu on 9 January from USD 3.7/MBtu the previous week. It then fell to USD 3.6/MBtu on 10 January, but rose slightly for two consecutive business days to USD 3.7/MBtu on 12 January.
On 13 January, HH fell to USD 3.4/MBtu amid speculation that Freeport LNG had canceled some cargoes scheduled for February loading. According to the EIA Weekly Natural Gas Storage Report released on 12 January, the U.S. natural gas underground storage on 6 January was 2,902 Bcf, up 11 Bcf from the previous week, down 4.6% from the same period last year, and down 1.4% from the historical five-year average.
Updated 16 January 2023
Source: JOGMEC

